 Essen, horizontal view
Internet Project
Observing, Photographing and Evaluating the
Transit of Venus, June 8th, 2004
 Essen, equatorial view
|
Essen, horizontal view
|
Internet ProjectObserving, Photographing and Evaluating theTransit of Venus, June 8th, 2004 |
Essen, equatorial view
|
| City, Country | Name/Organization | Example picture | sheet of position data |
|---|---|---|---|
| Bad Sobernheim, Germany | Emanual-Felke-Gymnasium | 080000UT.jpg)
| Sobernheim(Beutel).xls |
| Barcelona, Spain | 
| Tordera2.xls | |
| Cairo, Egypt | Deutsche Evangelische Oberschule | 
| Kairo3.xls |
| Essen, Germany | Universität Duisburg-Essen (More results can be found here.) | 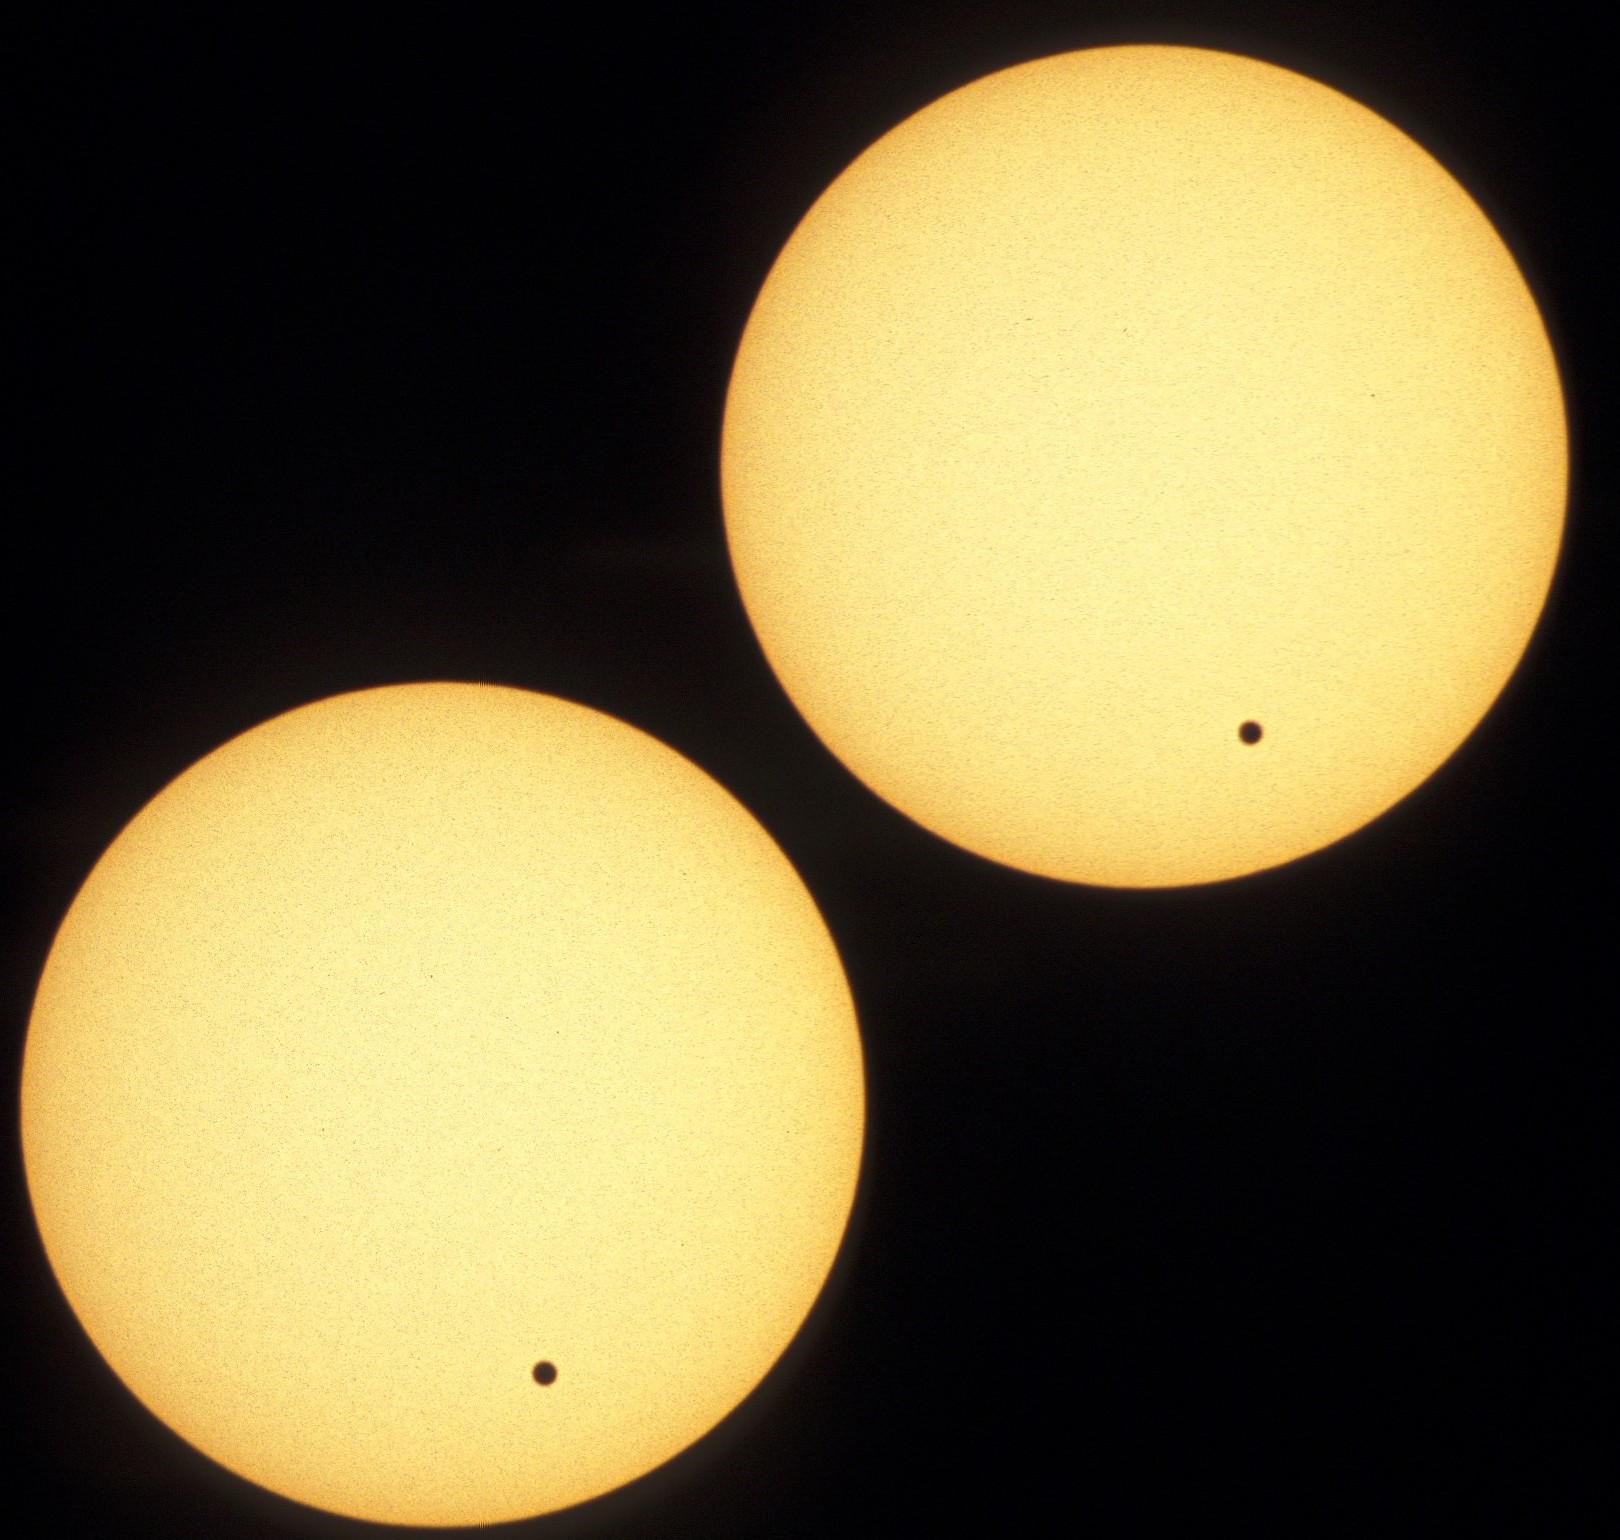
| Essen(Becker).xls |
| Isfahan, Iran | Isfahan University of Technology | .jpg)
| Isfahan(Mokhlespour).xls |
| Isfahan, Iran | Hedayatgaran Research Center | Isfahan(Akoochekian).xls | |
| Leatherhead/Ashtead, England | Robert Jurjevic (More results can be found here.) | 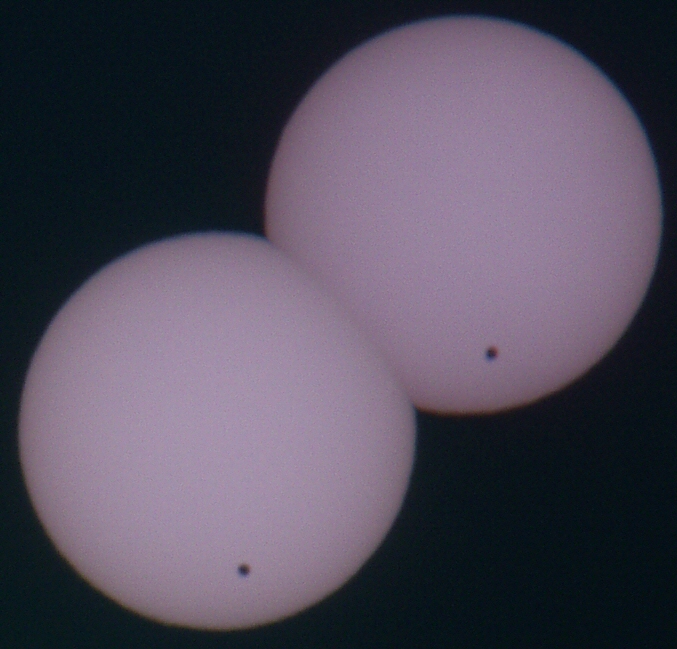
| LeatherheadAshtead(Jurjevic).xls |
| Menden, Germany | Städt. Walram-Gymnasium | 1000UT.jpg)
| Menden(Walram).xls |
| Namibia (v. Grumbkow) | International Amateur Observatory | 1000UT.jpg)
| Namibia(Grumbkow)3.xls |
| Namibia (Ohlert) | International Amateur Observatory | 
| Namibia(Ohlert).xls |
| Osnabrück, Germany | Planetarium | 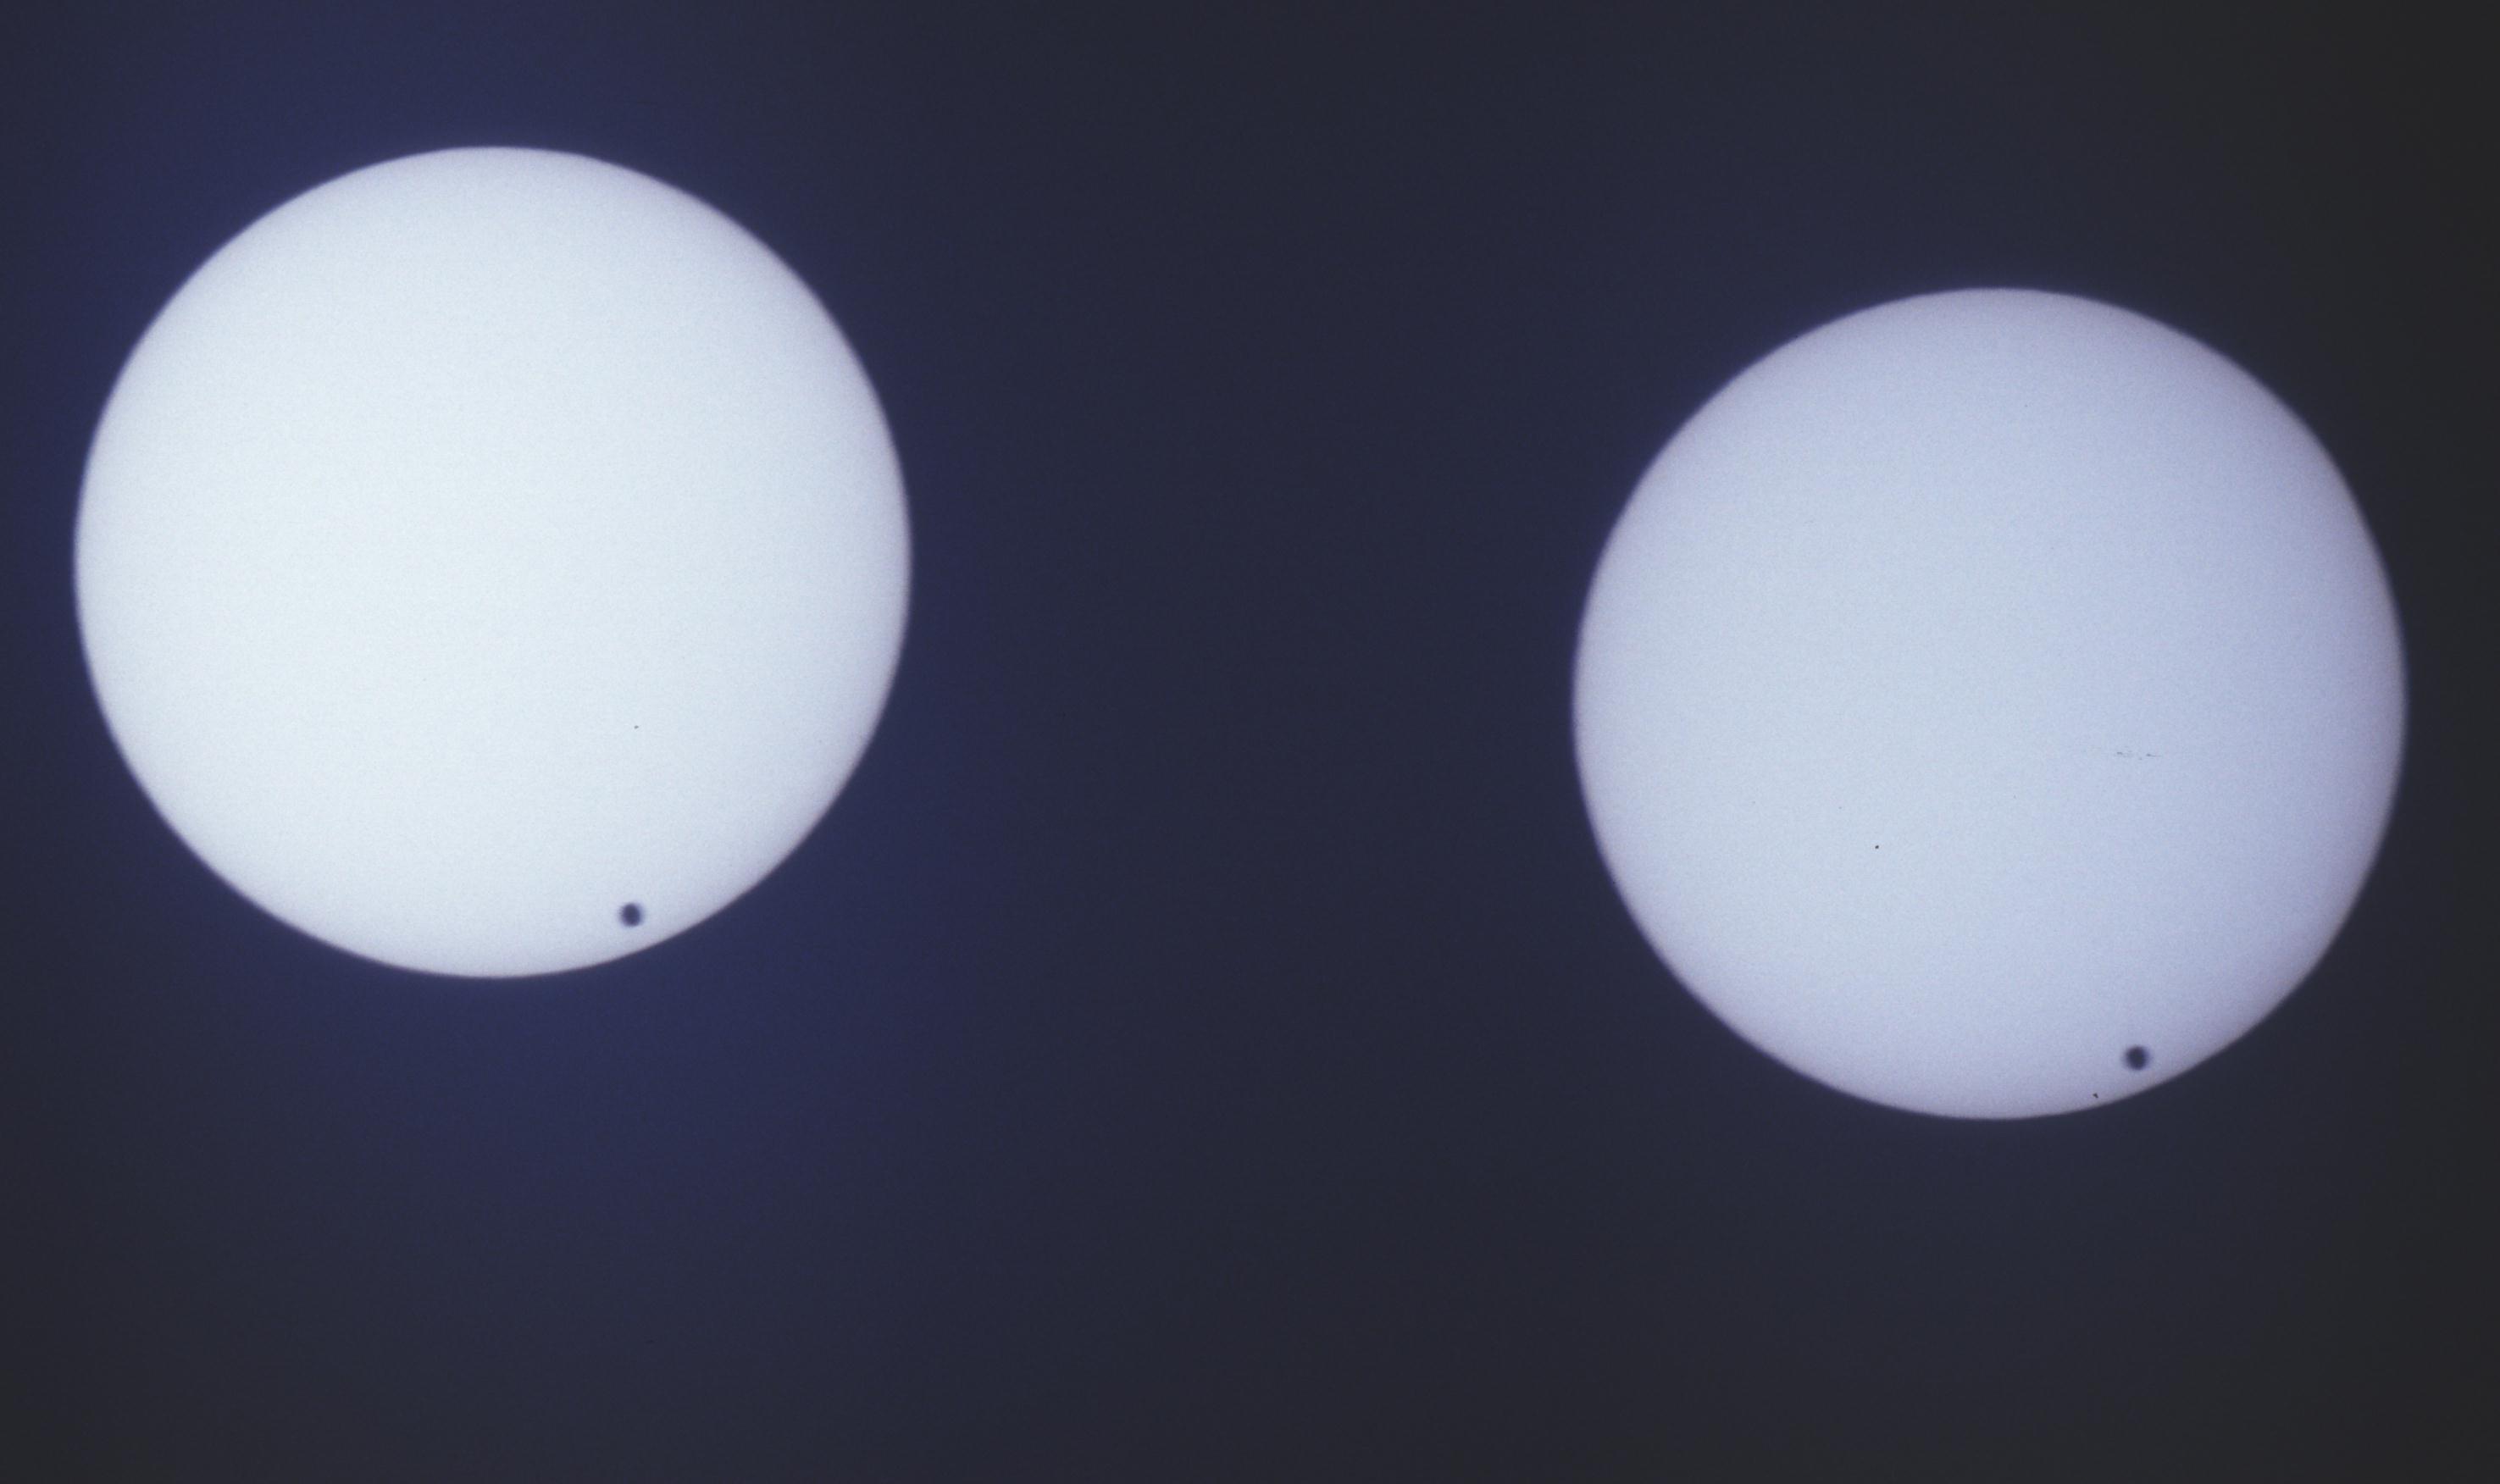
| Osnabrueck(Haenel).xls |
| Pforzheim, Germany | Kepler-Gymnasium | .jpg)
| Pforzheim(Friederich).xls |
| Recklinghausen, Germany | Sternwarte Recklinghausen | 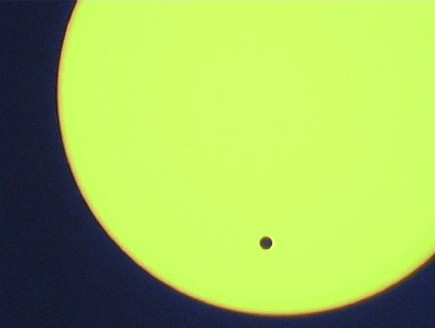
| Recklinghausen.xls |
| Ulm, Germany | Universität Duisburg-Essen | 
| Ulm(Moeller).xls |
| Valverde, Portugal | Valverde(Gregorio).xls |
| Learmonth, Australia
(The complete results can be found here) | 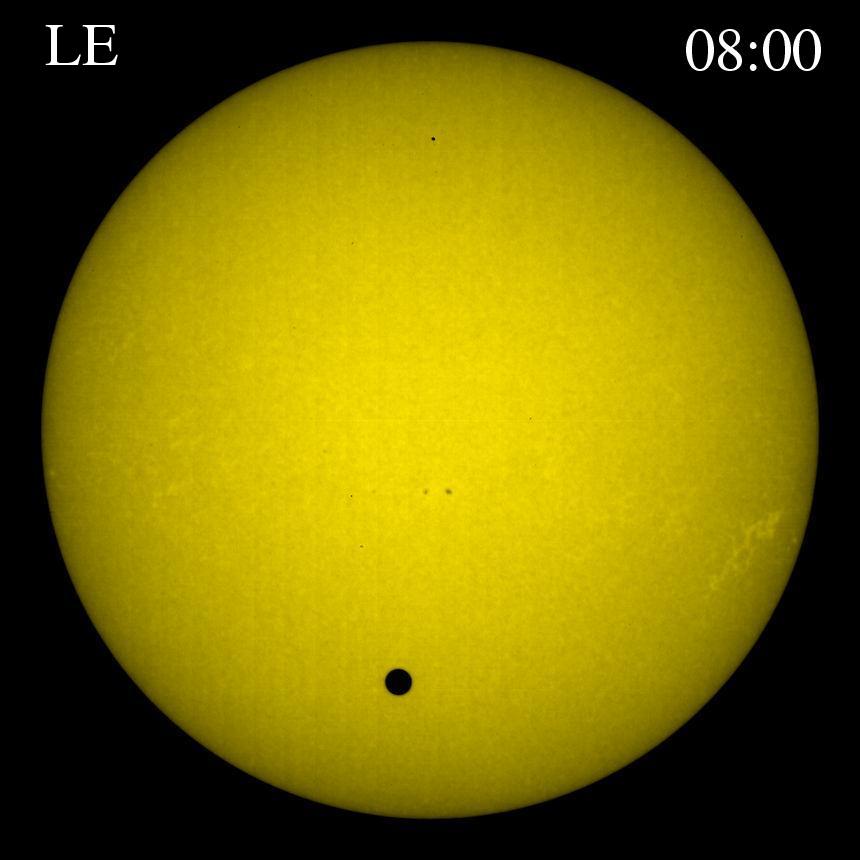
| PositionstabelleLeizi.xls | |
|---|---|---|---|
| Udaipur, India
(The complete results can be found here) | 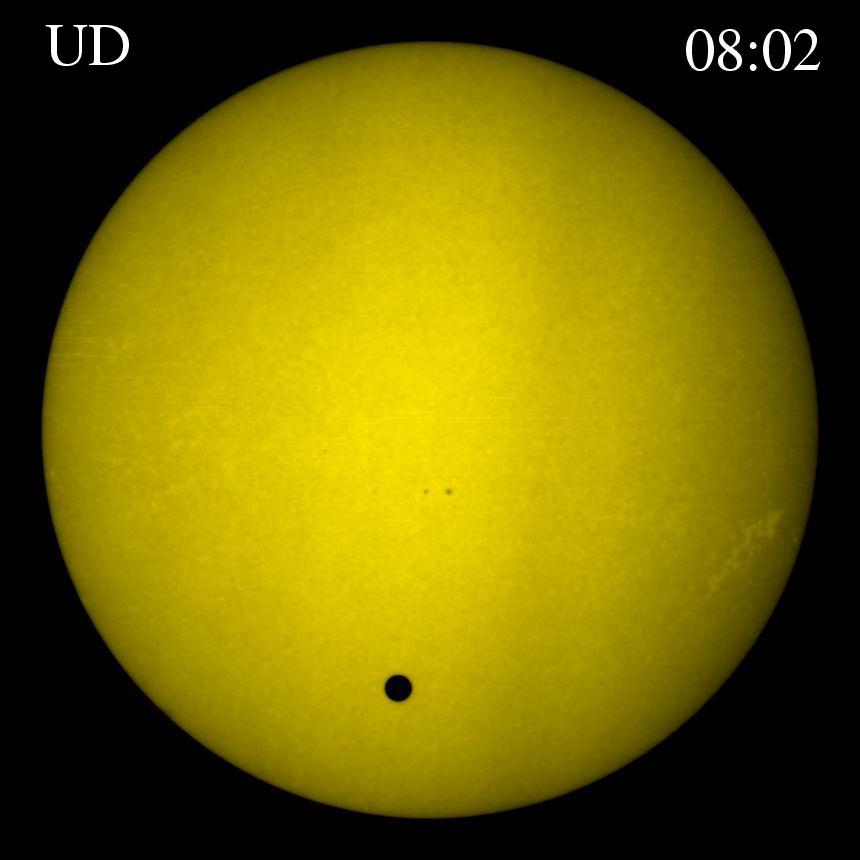
| PositionstabelleUdizi.xls | |
| El Teide, Tenerife, Spain
(The complete results can be found here) | 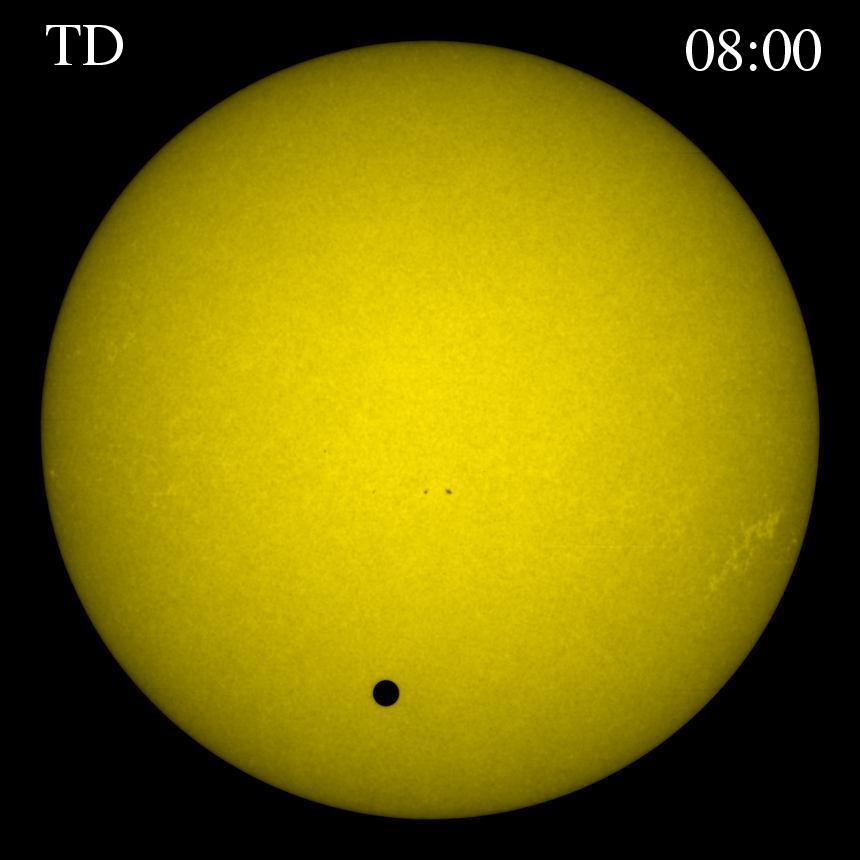
| PositionstabelleTdzi.xls |
| hypothetical geocentric observer | 
| Geocentre.xls |
|---|
The pictures in the right column below show the results of this comparison:
| City | Summery of position data | Determination of the Solar Parallax by Comparison with geocentric data |
|---|---|---|
| Essen (theoretically) (calculated with the aid of JPL Horizons) | 
| 
|
| Bad Sobernheim | 2.gif)
| 
|
| Barcelona | 
| 
|
| Cairo | 3.gif)
| 
|
| Essen | .gif)
| 
|
| Isfahan (Akoochekian) | 2.gif)
| 
|
| Isfahan (Mokhlespour) | .gif)
| 
|
| Learmonth | 
| 
|
| Leatherhead/Ashtead | 
| 
|
| Menden | .gif)
| 
|
| Namibia (v. Grumbkow) | 
| 
|
| Namibia (Ohlert) | 
| 
|
| Osnabrück | .gif)
| 
|
| Pforzheim | .gif)
| 
|
| Recklinghausen | 
| 
|
| Ulm | .gif)
| 
|
| Valverde | .gif)
| 
|
The following table combines all "internal" results for the solar parallax and gives an impression of the fidelity of our observational data.
| line fit | rmin | median | |
|---|---|---|---|
| Ashtead/Leatherhead | 4.1 | 3.0 | 12.9±7.8 |
| Essen | 7.9 | 5.7 | 7.6±1.3 |
| Menden | 10.0 | 7.5 | 10.4±6.6 |
| Osnabrück | 17.0 | 9.0 | 20.7±6.8 |
| Pforzheim | 4.4 | 0.1 | 5.1±3.0 |
| Recklinghausen | 8.5 | 7.3 | 8.3±1.5 |
| Sobernheim | 4.2 | 3.2 | 5.1±2.3 |
| Ulm | 8.6 | 7.0 | 9.5±1.9 |
| Valverde | 5.7 | 0.9 | 33.9±6.7 |
| Isfahan (Akoochekian) | 18.7 | 12.0 | 5.5±0.8 |
| Isfahan (Moklespour) | 11.9 | 10.8 | 15.5 |
| Cairo | 10.1 | 1.5 | 12.6±3.1 |
| Learmonth | 8.9 | 6.9 | 9.0±0.8 |
| Namibia (v. Grumbkow) | 10.8 | 4.4 | 11.4±2.7 |
| Namibia (Ohlert) | 10.4 | 7.0 | 10.7±0.6 |
The measured positions do not allow to determine the solar parallax by comparing European data. We, therefore, concentrate on combinations of European sites with those from outside of Europe.
The following tables show the calculated values for the solar parallax in arcseconds which we have determined by the methods described above.
| V | IA | IM | C | L | NG | NO | ||
|---|---|---|---|---|---|---|---|---|
| A | 19.1 | 9.4 | 4.5 | 6.8 | 6.3 | 93.3 | 9.4* | |
| E | 17.0 | 14.5 | 6.6 | 14.5 | 8.6* | 8.1* | 8.8* | |
| M | 25.2 | 20.4 | 10.9 | 18.4 | 11.1 | 7.5* | 9.8* | |
| O | 44 | 30 | 29 | 32 | 14.9 | 8.7* | 10.9 | |
| P | 19.7 | 7.7 | 6.7 | 6.3 | 7.0* | 6.9* | 8.4* | |
| R | 17.5 | 17.9 | 4.1 | 13.9 | 8.4 | 9.3 | 10.0 | |
| S | 9.8 | 12.7 | 4.0 | 9.2 | 8.5* | 6.1* | 8.1* | |
| U | 26.3 | 15.6 | 4.3 | 14.7 | 8.8* | 10.1* | 10.7 | |
| V | - | 12.5 | 4.3 | 12.8 | 8.1* | 4.6 | 7.3 | |
| IA | - | - | 11.5 | 7.5* | 11.8 | 12.3 | ||
| IM | - | 9.8 | 11.9 | 10.8 | 15.5 | |||
| C | - | 8.2* | 12.0 | 13.1 | ||||
| L | - | 11.3 | 8.7 | |||||
| V | IA | IM | C | L | NG | NO | ||
|---|---|---|---|---|---|---|---|---|
| G | 0.9 | 12.0 | 8.6 | 1.5 | 9.8 | 3.6 | 12.0 | |
| A | 7.4 | 7.1 | 1.3 | 3.9 | 5.1 | 7.1 | ||
| E | 14.5 | 10.6 | 4.4 | 9.0* | 6.4 | 6.8 | 8.6* | |
| M | 19.8 | 13.0 | 6.8 | 11.5 | 8.8 | 7.1 | 9.7* | |
| O | 23.0 | 14.9 | 8.7 | 13.8 | 9.5 | 8.0 | 10.5 | |
| P | 2.8 | 3.9 | 2.6 | 1.3 | 5.6 | 2.7 | 5.1 | |
| R | 25.3 | 13.9 | 13.8 | 11.4 | 7.1 | 7.7 | 9.3 | |
| S | 8.0 | 7.7 | 1.4 | 4.3 | 7.0 | 4.6 | 7.3 | |
| U | 21.2 | 12.4 | 5.9 | 12.6 | 7.2 | 8.0 | 9.7* | |
| V | - | 4.6 | 1.6 | 0.2 | 6.0 | 3.8 | 6.9 | |
| IA | - | - | 8.4 | 6.5 | 0.9 | 8.6* | ||
| IM | - | 3.2 | 9.8 | 4.7 | 12.5 | |||
| C | - | 7.3 | 4.4 | 8.2* | ||||
| L | - | 2.0 | 0.4 | |||||
| IA | IM | C | L | NG | NO | |
|---|---|---|---|---|---|---|
| G | 5.0±0.8 | 20.6 | 12.6±3.1 | 8.9±0.7* | 11.5±2.7 | |
| A | 36.6±6.0 | 5.8 | 21.2±6.2 | 9.8±4.1 | 10.5±3.8 | 10.1±1.5 |
| E | 11.4 | 13.8±5.8 | 9.0±0.5* | 8.0±1.9* | 8.9±0.4* | |
| M | 21.2±4.9 | 32.1±0.8 | 11.2±4.8 | 11.4±1.5 | 11.3±0.0 | |
| O | 24.2±6.1 | 10.9 | 10.8±2.1 | |||
| R | 11.7 | 13.1±3.9 | 8.7±0.4 | 10.1±2.1 | 10.4±0.6 | |
| S | 11.3±5.9 | 9.7±4.0 | 9.2 | 7.5±1.0* | 8.1±2.5* | 7.8±0.8 |
| U | 14.6±3.4 | 9.0 | 16.5±5.8 | 8.8±0.5* | 10.2±1.7* | 10.6±0.6 |
| V | 15.9 | 8.5 | 82±16 | 42±1 | 8.6±4.0 | 9.6±2.2 |
| IA | - | 21.4 | 4.6 | - | ||
| IM | 19.1 | 11.6 | 15.9 | |||
| C | 6.7±1.1* | 14.3±4.7 | 13.3±3.4 | |||
| L | 11.4±1.7 | 8.8±0.0* | ||||
The combination Bad Sobernheim/Cairo clearly demonstrates the advantage of the line fits. The comparisons between Ulm/Learmonth and Essen/Namibia below show some of the most satisfying results.
| Bad Sobernheim/Cairo | Essen/NamibiaG | Essen/NamibiaO | Ulm/Learmonth |
|---|---|---|---|
| 
| 
| 
|
Some remarks to the difficulties due to the size of the solar picture, the orientation of the pictures and to the restichtions of Bildauswertung.exe will be given later.

 Udo Backhaus